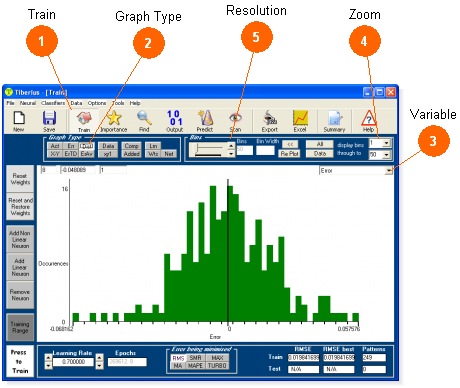
Histograms of the raw data, final model scores and model errors can be viewed.
The graph options are on the 'Train' window.
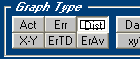
Select Graph Type 'Dist' to view the histograms.
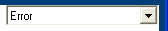
Select the variable of interest from the drop down list. It is easy to scan through all variables by using the down arrow key.
Zoom into regions of the plot. Alternatively left mouse click over the plot and drag.
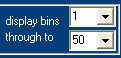
Change the 'bin width' of the plots to adjust the resolution.