tiberius data mining Predictive Modelling Software 'attractively simple'   
 
  Tiberius Data Mining

Variable Distributions

Variable Distributions

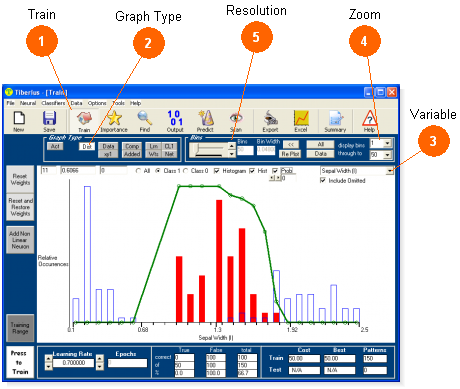
Histograms (split by class) of the raw data, final model scores and model errors can be viewed.


These histograms should give a graphic demonstration of why certain variables are important and why some are not. The red and blue bars indicate the class distribution. Separation of the two colours should be more evident for the more important variables in the model.


1 . TrainTrain

Train

The graph options are on the 'Train' window.


2 . Graph TypeGraph Type

Graph Type

Select Graph Type 'Dist' to view the histograms.


3 . VariableVariable

Variable

Select the variable of interest from the drop down list. It is easy to scan through all variables by using the down arrow key.


4 . ZoomZoom

Zoom

Zoom into regions of the plot. Alternatively left mouse click over the plot and drag.


5 . ResolutionResolution

Resolution

Change the 'bin width' of the plots to adjust the resolution.