Once the data has loaded, it can be viewed by selecting the appropriate graphs from the 'Graph Type' box.
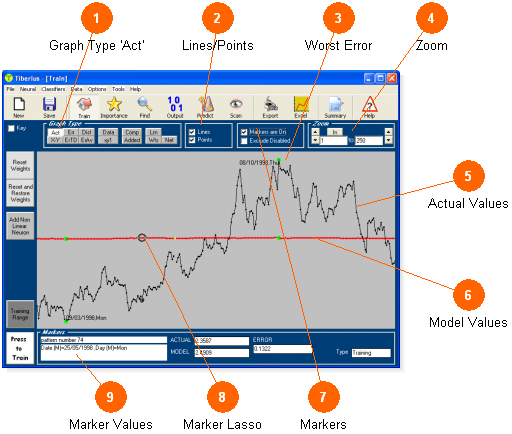
 Graph Type 'Act' Graph Type 'Act'
Select this graph type to look at a time series view of the data.
|
|
|
 Lines/Points Lines/Points
The data can be plotted with points, lines or both.
|
|
|
 Worst Error Worst Error
The marker value of the point with the largest model error is displayed on the plot.
|
|
|
 Zoom Zoom
Zoom in on the current view, or left click and drag on the plot to zoom into a particular region.
|
|
|
 Actual Values Actual Values
The actual data is displayed in black.
|
|
|
 Model Values Model Values
The current model values are red. The line starts off flat as no model has yet been built.
|
|
|
 Markers Markers
Selecting the 'Marker' option will display the associated data for a particular point as the mouse is moved across the plot.
|
|
|
 Marker Lasso Marker Lasso
The circle shows the point for which the current marker values are being displayed.
|
|
|
 Marker Values Marker Values
This is where the marker values are displayed.
|
|
|